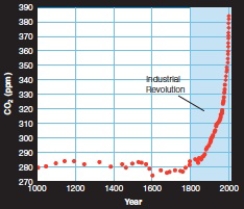
-What is the above graph showing
A) when the ozone hole formed
B) how the industrial revolution contributed to global warming
C) how the industrial revolution contributed to greenhouses gasses in Earth's atmosphere
D) None of the other choices are correct.
Correct Answer:
Verified
Q51: _ waves are seismic waves that do
Q52: By combining three oxygen atoms, a/an _
Q53: _ are great lava flows covering 17%
Q54: Colliding plates can generate _ ranges.
Q55: _, or dried seas of dark basalt,
Q57: Q58: Three major greenhouse gases in Earth's atmosphere Q59: The separation between Africa and the Arabian![]()
Unlock this Answer For Free Now!
View this answer and more for free by performing one of the following actions

Scan the QR code to install the App and get 2 free unlocks

Unlock quizzes for free by uploading documents