Multiple Choice
Figure 6-1
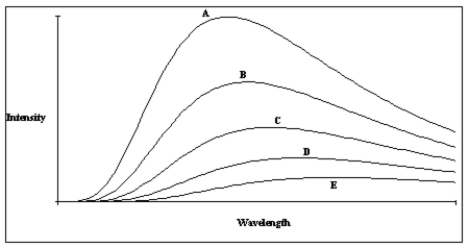
-A plot of the continuous spectra of five different stars is shown in Figure 6-1. Based on these spectra, which of the stars has the lowest temperature
A) Star A
B) Star B
C) Star C
D) Star D
E) Star E
Correct Answer:
Verified
Related Questions
Q13: The process of removing an electron from
Q14: Q15: Q16: The _ is responsible for binding the Q17: The lowest energy level in an atom Q19: Absolute zero is Unlock this Answer For Free Now! View this answer and more for free by performing one of the following actions Scan the QR code to install the App and get 2 free unlocks Unlock quizzes for free by uploading documents![]()
![]()
A)zero degrees Celsius.
B)the temperature at

