Insert non-labeled graph from page 150- replica created and inserted below 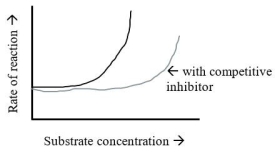
The graph shows the normal reaction rate of an enzyme and the reaction rate when a competitive inhibitor is present.Which description below explains the appearance of the graph?
A) As the substrate concentration increases,the activity of the enzyme decreases.
B) As the substrate concentration increases,the effect of the inhibitor was overcome and enzyme activity was restored.
C) As the enzyme concentration increased,the effect of the inhibitor was overcome and enzyme activity was restored.
D) As the enzyme concentration increased,the effect of the inhibitor was more pronounced.
E) As the competitive inhibitor concentration decreased,the reaction rate also decreased.
Correct Answer:
Verified
Q41: Figure 5.8 Q42: Carbon fixation occurs during the light-independent phase Q43: Figure 5.8 Q44: Researchers are developing a ribozyme that cleaves Q45: Figure 5.8 Q47: A urease test is used to identify Unlock this Answer For Free Now! View this answer and more for free by performing one of the following actions Scan the QR code to install the App and get 2 free unlocks Unlock quizzes for free by uploading documents
![]()
![]()
![]()

