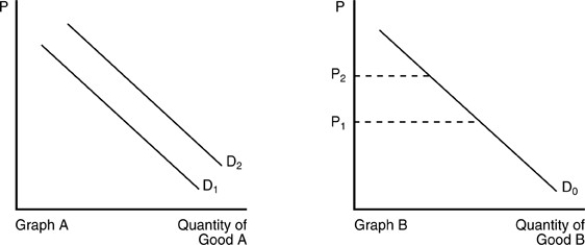
-In the above figure, the demand curve for Good A shifts from D₁ to D₂ in Graph A when the price of Good B changes from P₁ to P₂ in Graph B. We can conclude that
A) Good A and Good B are substitutes.
B) Good A and Good B are complements.
C) Good A is a normal good but Good B is an inferior good.
D) Good A and Good B are unrelated.
Correct Answer:
Verified
Q128: In economic terminology, a normal good is
Q131: If goods X and Y are substitute
Q137: A demand curve for a normal good
A)
Q140: Sarah gets a salary increase of 20
Q140: If bagels and croissants are substitute goods,
Q141: If two goods, J and K, are
Q144: There is an increase in the demand
Q144: Two goods are substitutes when
A) an increase
Q147: When the price of tablet devices decreased
Q148: After the price of smartphone apps falls,
Unlock this Answer For Free Now!
View this answer and more for free by performing one of the following actions

Scan the QR code to install the App and get 2 free unlocks

Unlock quizzes for free by uploading documents