Multiple Choice
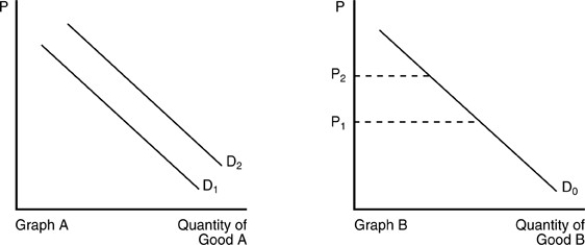
-In the above figure, when the price of Good B increases, the result can be shown by
A) the movement from D₁ to D₂ in Graph A.
B) the movement from D₂ to D₁ in Graph A.
C) the movement along D₀ from P₁ to P₂.
D) the movement along D�₀ from P₂ to P₁.
Correct Answer:
Verified
Related Questions
Q143: Which of the following pairs of goods
Q151: Suppose Good A is a normal good.
Q152: We observe that people buy less steak
Q153: An increase in the price of corn
Q154: An increase in demand for a good
Unlock this Answer For Free Now!
View this answer and more for free by performing one of the following actions

Scan the QR code to install the App and get 2 free unlocks

Unlock quizzes for free by uploading documents