Multiple Choice
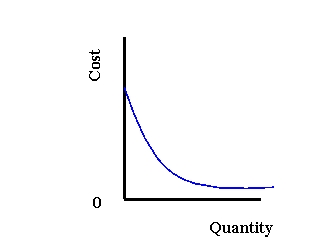
-Refer to Exhibit 10-3. The graph shown is most likely a(n)
A) average variable cost function
B) marginal cost function
C) average fixed cost function
Correct Answer:
Verified
Related Questions
Q30: At quantities larger than the quantity where
Q31: Producers can vary the capital they use
Q32: At that quantity where the SRAC of
Q33: At quantities smaller than the quantity where
Q34: Given the technology, SRAC is _ SRMC
Q35: Describe the difference between the short-run average
Unlock this Answer For Free Now!
View this answer and more for free by performing one of the following actions

Scan the QR code to install the App and get 2 free unlocks

Unlock quizzes for free by uploading documents