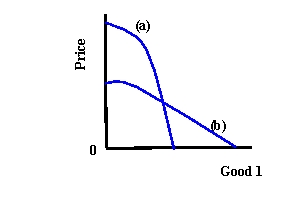
-Refer to Exhibit 4-4. Which curve represents the compensated demand function?
A) (a)
B) (b)
C) There is not enough information to give an answer.
Correct Answer:
Verified
Q23: Describe how prices are set in impersonal
Q24: Will the income effect always cause an
Q25: The substitution effect is the
A) change in
Q26: On the horizontal axis of a demand
Q27: Demand curves are generated by the
A) utility-maximizing
Q29: What happens to the substitution and income
Q30: A normal good is a good whose
Q31: Is the typical demand curve used in
Q32: If a price decrease causes income and
Q33: ![]()
Unlock this Answer For Free Now!
View this answer and more for free by performing one of the following actions

Scan the QR code to install the App and get 2 free unlocks

Unlock quizzes for free by uploading documents