Flood recurrence and probability graphs like the one shown below rely on historic records.The predictions for severe floods on graphs like this one are supported by few data points because data for such graphs have generally not been collected longer than a century.What effect would urbanization have on the reliability of using this kind of graph to calculate the frequency and severity of major floods? 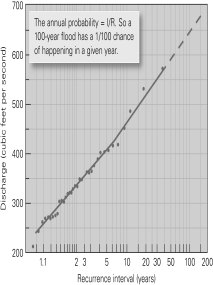
A) an underestimation of severe flood hazard
B) an overestimation of severe flood hazard
C) Urbanization would probably not affect the reliability of estimating severe flood hazard using this graphic predictive technique.
Correct Answer:
Verified
Q25: V-shaped stream valleys result from the downcutting
Q29: If a stream cuts through flat-lying sediments
Q42: All flooding events occur so rapidly that
Q44: Pirate streams _.
A)consist of a series of
Q45: If a 50-year flood occurs on the
Q47: If you were studying the sediments along
Q48: At a delta,_.
A) stream gradient decreases
B) a
Q49: The potential abrupt change of primary discharge
Q55: The construction of dams on major rivers
Q56: A meander that is cut off to
Unlock this Answer For Free Now!
View this answer and more for free by performing one of the following actions

Scan the QR code to install the App and get 2 free unlocks

Unlock quizzes for free by uploading documents