The next questions refer to the following table, which compares the percent sequence homology of four different parts (two introns and two exons) of a gene that is found in five different eukaryotic species. Each part is numbered to indicate its distance from the promoter (e.g., Intron I is the one closest to the promoter) . The data reported for species A were obtained by comparing DNA from one member of species A to another member of species A.
% Sequence Homology
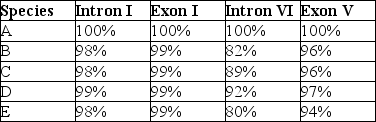
-Based on the tabular data, and assuming that time advances vertically, which cladogram (a type of phylogenetic tree) is the most likely depiction of the evolutionary relationships among these five species?
A) 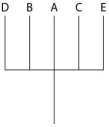
B) 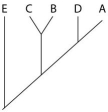
C) 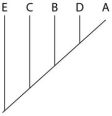
D) 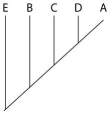
Correct Answer:
Verified
Q48: It was once thought that cetaceans had
Q58: Use the following figure to answer the
Q60: Q61: Traditionally, zoologists have placed birds in their Q62: Traditionally, zoologists have placed birds in their Q63: To apply parsimony to constructing a phylogenetic Q66: The next questions refer to the following Q66: Use the following figure to answer the Q68: Which of these can be properly inferred Q69: The next questions refer to the following![]()
Unlock this Answer For Free Now!
View this answer and more for free by performing one of the following actions

Scan the QR code to install the App and get 2 free unlocks

Unlock quizzes for free by uploading documents