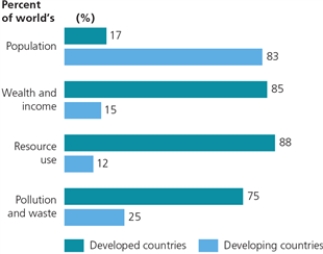
Figure 1-3 -Based on the Above Graph,how Might the Disproportionate Use of the Disproportionate
Figure 1-3

-Based on the above graph,how might the disproportionate use of resources by developed countries be reduced?
Correct Answer:
Verified
View Answer
Unlock this answer now
Get Access to more Verified Answers free of charge
Q61: A chemical dumpsite would be an example
Q66: Fish, fresh water, wild animals, and fertile
Q69: Developing countries have a(n)_ _ which proposes
Q72: Leaving drink cans and plastic materials at
Q73: Population (P)× Consumption per person (affluence,A)× _
Q75: _-_ resources are not owned by a
Q76: Canada and Spain almost went to war
Q77: If you have more than five credit
Q78: _ growth increases at a constant rate
Q79: Non-renewable resources include _ resources such as
Unlock this Answer For Free Now!
View this answer and more for free by performing one of the following actions

Scan the QR code to install the App and get 2 free unlocks

Unlock quizzes for free by uploading documents