Multiple Choice
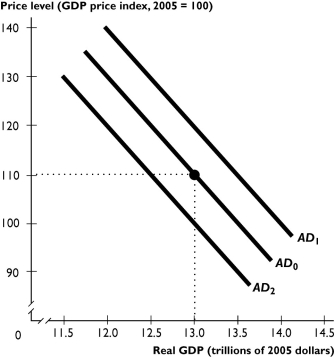
The figure above shows aggregate demand curves.
-Based on the figure above, the aggregate demand curve will shift from AD₀ to AD₂ when
A) potential GDP increases.
B) the price level falls.
C) taxes are lowered.
D) government expenditure increases.
E) the Federal Reserve raises the interest rate.
Correct Answer:
Verified
Related Questions

