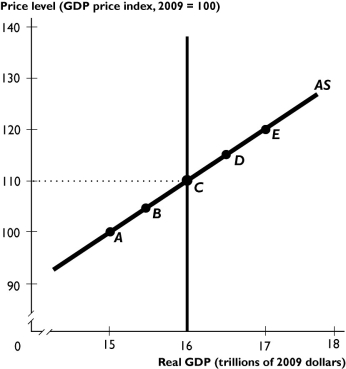
 The figure above shows the aggregate supply curve and potential GDP.
-Based on the figure above,the aggregate supply curve shifts rightward and the potential GDP line does not change when
A) the money wage rate rises.
B) the price level rises.
C) the money wage rate falls.
D) the price level falls.
E) both the price level and money wage rate rise by the same proportion.
Correct Answer:
Verified
Q218: Suppose that the money prices of raw
Q219: Cost-push inflation starts with
A)an increase in aggregate
Q220: In a demand-pull inflation,money wage rates rise
Q221: An increase in investment _ aggregate demand,the
Q222: An inflationary gap is created when
A)real GDP
Q224: A combination of recession and inflation is
Q225: In reality,AD rarely _;however,the economy performs as
Q226: Stagflation is a combination of _ real
Q227: Reasons that the recession of 2008-2009 did
Q228: Oil price hikes
A)increase aggregate supply.
B)decrease aggregate supply.
C)increase
Unlock this Answer For Free Now!
View this answer and more for free by performing one of the following actions

Scan the QR code to install the App and get 2 free unlocks

Unlock quizzes for free by uploading documents