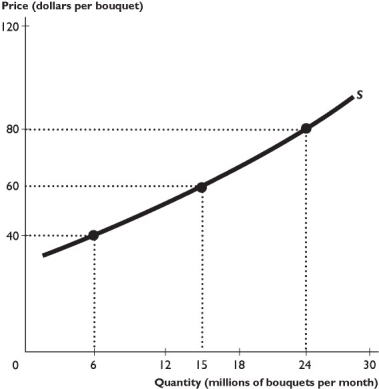
The figure above shows the supply curve for roses.
-Suppose an increase in supply lowers the price from $10 to $8 and increases the quantity demanded from 100 units to 130 units.Using the midpoint method,the elasticity of demand equals
A) 1.17.
B) 0.85.
C) 0.26.
D) 1.56.
E) None of the above answers is correct.
Correct Answer:
Verified
Q272: The total revenue test says that if
Q273: Q274: Suppose Starbucks currently charges $3.25 per cup Q275: The total revenue test says that if Q276: If you spend a large portion of Q278: If demand is _,a price cut _![]()
Unlock this Answer For Free Now!
View this answer and more for free by performing one of the following actions

Scan the QR code to install the App and get 2 free unlocks

Unlock quizzes for free by uploading documents