The scatter diagram below depicts which type of relationship? 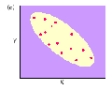
A) zero correlation.
B) positive relationship.
C) variable relationship.
D) negative relationship.
Correct Answer:
Verified
Q100: If the mean on a test is
Q101: When measure X gets smaller,measure Y also
Q102: Josh is viewing a scatter diagram and
Q103: A mathematical relationship in which increases in
Q104: What percent of all cases are found
Q106: When measure X gets larger,measure Y also
Q107: In order to clearly visualize the correlation,Dr.Amott
Q108: The type of graph depicted below is
Q109: Which of the following is NOT an
Q110: When two variables vary together in some
Unlock this Answer For Free Now!
View this answer and more for free by performing one of the following actions

Scan the QR code to install the App and get 2 free unlocks

Unlock quizzes for free by uploading documents