Related Questions
Q57: A scatter chart is displayed vertically and
Q58: To create a line chart,at least one
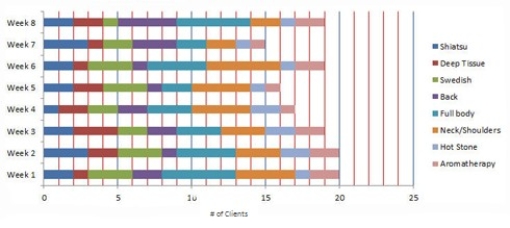
Q59: A bar chart is displayed horizontally and
Q60: To create a pie chart,two data series,the
Q61: A(n)_ chart highlights regions showing growth over
Q64: _ is the graphical presentation of data
Q67: A(n)_ chart is displayed vertically and is
Q67: To change the style of a chart,you
Q75: If you wanted to see if there
Q80: A(n)_ is a special worksheet that only
Unlock this Answer For Free Now!
View this answer and more for free by performing one of the following actions

Scan the QR code to install the App and get 2 free unlocks

Unlock quizzes for free by uploading documents
