Multiple Choice
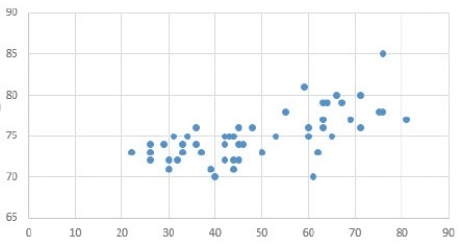
The chart shown above depicts a(n) ________ chart.
A) Area
B) Radar
C) Scatter
D) Cluster
Correct Answer:
Verified
Related Questions
Q15: To enter a footer or header to
Q16: If you wanted to see how the
Q17: The related data values used in creating
Q18: To view additional information or modify labels,you
Q19: Excel's _ feature analyzes a selection in
Unlock this Answer For Free Now!
View this answer and more for free by performing one of the following actions

Scan the QR code to install the App and get 2 free unlocks

Unlock quizzes for free by uploading documents