Figure 24-1 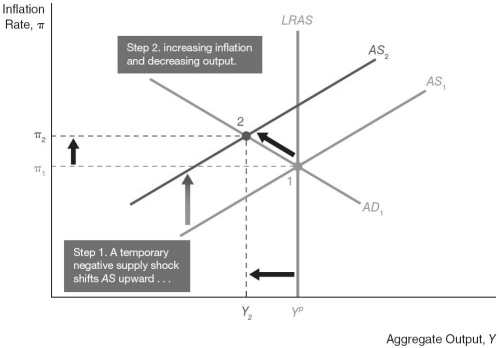
-In Figure 24.1 above,at point 2,the shift of the aggregate supply curve from AS1 to AS2 is a result of ________ wages that ________ production cost.
A) increasing; increase
B) increasing; reduce
C) decreasing; decrease
D) decreasing; increase
Correct Answer:
Verified
Q66: According to aggregate demand and supply analysis,the
Q68: Because shifts in aggregate demand are not
Q73: According to aggregate demand and supply analysis,the
Q76: According to aggregate demand and supply analysis,the
Q77: This theory views shocks to tastes (workers'
Q93: Figure 24-1 Q95: According to aggregate demand and supply analysis, Q98: Suppose the Canadian economy is producing at Q100: Suppose the Canadian economy is producing at Q100: Figure 24-1 ![]()
![]()
Unlock this Answer For Free Now!
View this answer and more for free by performing one of the following actions

Scan the QR code to install the App and get 2 free unlocks

Unlock quizzes for free by uploading documents