Table 23-2
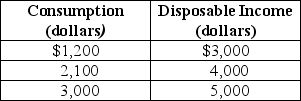
-Refer to Table 23-2.Given the consumption schedule in the table above,the marginal propensity to consume is
A) 0.1.
B) 0.3.
C) 0.6.
D) 0.9.
Correct Answer:
Verified
Q50: Increases in housing prices
A) decrease consumption in
Q58: Housing wealth is equal to
A) the market
Q65: Decreases in the price level will
A)lower consumption
Q70: A stock market boom which causes stock
Q71: Examples of assets that are included in
Q90: If disposable income falls by $50 billion
Q92: If the marginal propensity to save is
Q95: Which of the following will raise consumer
Q97: _ describes the relationship between consumption spending
Q99: When we graph consumption as a function
Unlock this Answer For Free Now!
View this answer and more for free by performing one of the following actions

Scan the QR code to install the App and get 2 free unlocks

Unlock quizzes for free by uploading documents