Figure 13-6
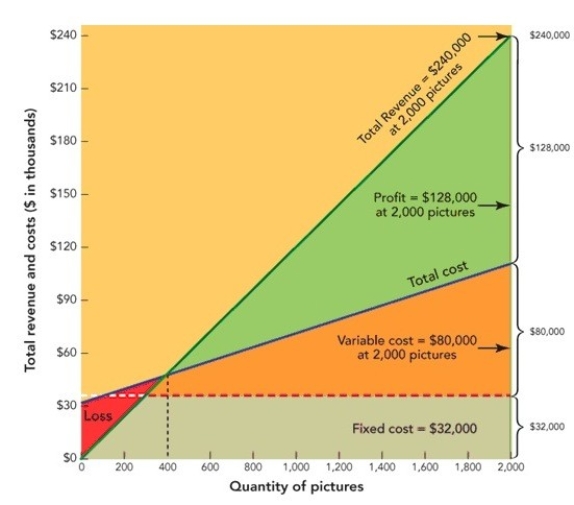
-Figure 13-6 above depicts a
A) Gantt chart.
B) demand curve.
C) break-even chart.
D) ROI analysis.
E) cross-tabulation.
Correct Answer:
Verified
Q145: Inelastic demand exists when
A) a small percentage
Q164: Rent, executive salaries, and insurance are typical
Q168: The sum of the firm's expenses that
Q169: Forever Quilting makes quilting kits priced at
Q180: Which of the following is a typical
Q180: Total cost refers to
A) the sum of
Q182: A break-even chart is a graphic presentation
A)that
Q184: Tim Marlow, the owner of The Clock
Q191: The break-even point (BEP) = [Fixed cost
Q199: The owner of a small restaurant that
Unlock this Answer For Free Now!
View this answer and more for free by performing one of the following actions

Scan the QR code to install the App and get 2 free unlocks

Unlock quizzes for free by uploading documents