-The Figure Above Shows the Relationship Between the Price of a Dozen
Question 250
Question 250
Multiple Choice
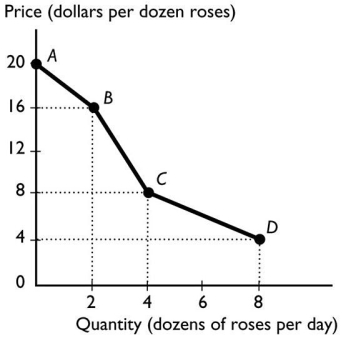
-The figure above shows the relationship between the price of a dozen roses and the quantity of roses a florist can sell.The slope between points A and B is
A) 20. B) 16. C) 4. D) 2. E) non-existent because at point A no roses are sold.
Correct Answer:
Verified
Unlock this answer now Get Access to more Verified Answers free of charge