Figure 15-2
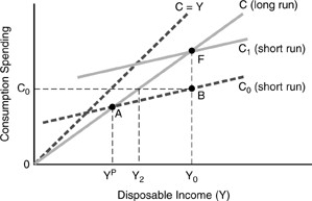
-In Figure 15-2 above,the difference between consumption levels at point A and point B is equal to
A) the long run MPC times the change in disposable income.
B) the short run MPC times the change in disposable income.
C) (Y₀ - Y₂) times the short run change in income.
D) the long run change in income times (Y₀ - YP) .
Correct Answer:
Verified
Q67: With a temporary income tax surcharge,according to
Q68: A lower interest rate
A)lowers the marginal propensity
Q69: Suppose that medical researchers discover a new
Q70: Modigliani's consumption function differs from both Friedman's
Q71: In the life-cycle hypothesis,people are assumed to
Q73: With a temporary income tax surcharge,according to
Q74: The PIH and LCH theories _ the
Q75: Less developed countries are often characterized by
Q76: The application of rational expectations to the
Q77: Milton Friedman first proposed the hypothesis that
Unlock this Answer For Free Now!
View this answer and more for free by performing one of the following actions

Scan the QR code to install the App and get 2 free unlocks

Unlock quizzes for free by uploading documents