Multiple Choice
Figure 13-4
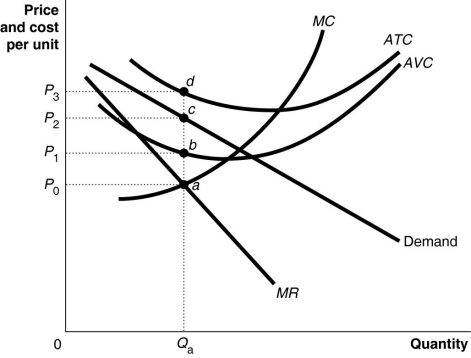
Figure 13-4 shows short-run cost and demand curves for a monopolistically competitive firm in the market for designer watches.
-Refer to Figure 13-4.What is the area that represents the loss made by the firm?
A) the area P₀adP₃
B) the area P₁bcP₂
C) the area P₀acP₂
D) the area P₂cdP₃
Correct Answer:
Verified
Related Questions

