Use the figure below to answer the following questions.
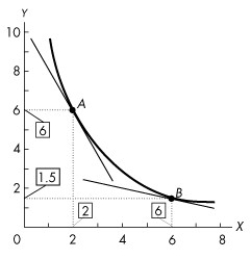
Figure 1A.3.10
-Refer to Figure 1A.3.10. The figure shows a relationship between two variables, x and y. The slope at point B is
A) 2.
B) -2.
C) 0.25.
D) -0.25.
E) 0.5.
Correct Answer:
Verified
Q155: Use the figure below to answer the
Q161: Use the figure below to answer the
Q162: Use the table below to answer the
Q165: Use the figure below to answer the
Q167: Use the table below to answer the
Q170: Use the figure below to answer the
Q172: Use the figure below to answer the
Q173: Use the figure below to answer the
Q174: Use the table below to answer the
Q178: Use the table below to answer the
Unlock this Answer For Free Now!
View this answer and more for free by performing one of the following actions

Scan the QR code to install the App and get 2 free unlocks

Unlock quizzes for free by uploading documents