You are analyzing sales data and eating habits of students in a school cafeteria, you created a PivotTable with Date as a ROW and Extended Price as a summed VALUE.Which of the following Pivot Tables would demonstrate best what would happen if you added Category to the COLUMNS area?
A) 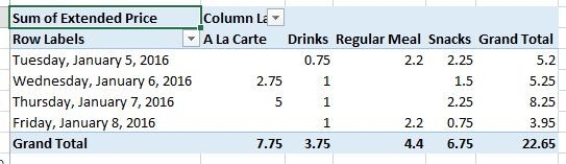
B) 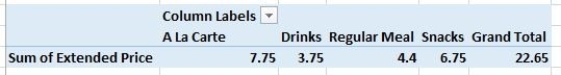
C) 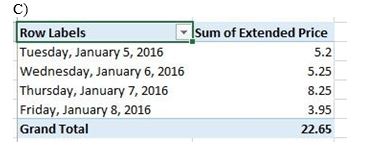
D) 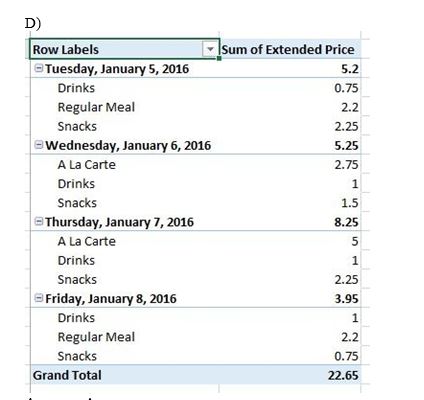
Correct Answer:
Verified
Q11: What does a + button indicate to
Q12: You have a PivotTable with 2 fields
Q13: A(n)_ is an interactive table which uses
Q14: Which is an effective way to change
Q15: A subtotal row must contain at least
Q17: Which function is not a Subtotal function?
A)MAX
B)SUM
C)AGGREGATE
D)AVERAGE
Q18: Which of the following is not a
Q19: What dictates the order of hierarchy of
Q20: Grouping is _.
A)using a VLOOKUP function to
Q21: Using the % of Grand Total Calculation
Unlock this Answer For Free Now!
View this answer and more for free by performing one of the following actions

Scan the QR code to install the App and get 2 free unlocks

Unlock quizzes for free by uploading documents