Use the figure below to answer the following question.
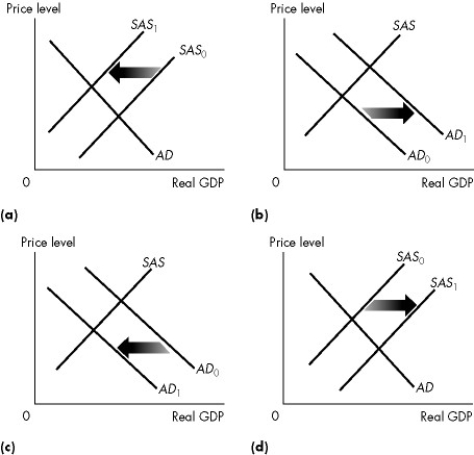
Figure 28.2.5
-Refer to Figure 28.2.5. Which one of the graphs in the figure represents an economy experiencing stagflation?
A) (a) only
B) (b) only
C) (c) only
D) (d) only
E) Both (a) and (c)
Correct Answer:
Verified
Q67: Deflation ends with
A)an increase in the growth
Q68: A forecast that is based on all
Q69: Use the information below to answer the
Q70: Deflation occurs when
A)aggregate demand increases at a
Q70: Suppose that the money prices of raw
Q71: An unanticipated deflation does all of the
Q73: Along the short-run Phillips curve, everything remaining
Q74: Use the figure below to answer the
Q76: Choose the statement that is incorrect.
A)In a
Q77: When the price level is rising and,
Unlock this Answer For Free Now!
View this answer and more for free by performing one of the following actions

Scan the QR code to install the App and get 2 free unlocks

Unlock quizzes for free by uploading documents