Use the figure below to answer the following questions.
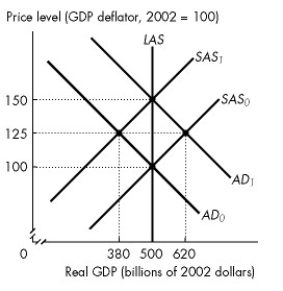
Figure 28.2.3
-Refer to Figure 28.2.3. Assume that the figure illustrates an economy initially in equilibrium at the intersection of the SAS₀ curve and the AD₀ curve. If the aggregate demand curve is expected to shift to AD₁ but remains at AD₀, the new equilibrium real GDP is ________ and the new equilibrium price level is ________.
A) $380 billion; 100
B) $500 billion; 150
C) $500 billion; 100
D) $620 billion; 125
E) $380 billion; 125
Correct Answer:
Verified
Q48: An increase in the price level due
Q49: Use the figure below to answer the
Q50: Use the figure below to answer the
Q51: Use the figure below to answer the
Q52: Use the figure below to answer the
Q54: A cost-price inflation spiral results if the
Q55: Stagflation can result from
A)a leftward shift of
Q56: Suppose the quantity of money is expected
Q57: A correctly anticipated increase in the quantity
Q58: Use the figure below to answer the
Unlock this Answer For Free Now!
View this answer and more for free by performing one of the following actions

Scan the QR code to install the App and get 2 free unlocks

Unlock quizzes for free by uploading documents