Use the table below to answer the following questions.
Table 27.1.1
The following table shows the relationship between consumption
expenditure (C) and disposable income (YD) for a hypothetical economy.
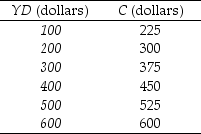
-Refer to Table 27.1.1. The marginal propensity to consume is
A) increasing as YD increases.
B) equal to 1 when YD equals $600.
C) 0.75.
D) 0.25.
E) 1.33.
Correct Answer:
Verified
Q27: The fraction of a change in disposable
Q28: Use the table below to answer the
Q29: The saving function shows the relationship between
Q30: Use the table below to answer the
Q31: Use the table below to answer the
Q33: Use the table below to answer the
Q34: The slope of the consumption function is
A)less
Q35: Use the figure below to answer the
Q36: Use the table below to answer the
Q37: Use the table below to answer the
Unlock this Answer For Free Now!
View this answer and more for free by performing one of the following actions

Scan the QR code to install the App and get 2 free unlocks

Unlock quizzes for free by uploading documents