Use the figure below to answer the following questions.
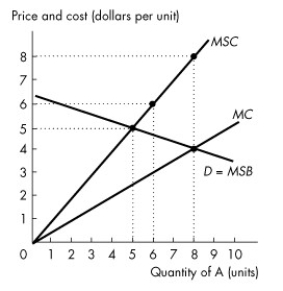
Figure 16.2.2
-Refer to Figure 16.2.2. This figure shows the demand curve, the marginal private cost curve and the marginal social cost curve of good A. How many units of good A are produced in an unregulated market?
A) 0 units
B) 5 units
C) 6 units
D) 8 units
E) 9 units
Correct Answer:
Verified
Q20: Use the figure below to answer the
Q21: Use the figure below to answer the
Q22: Use the table below to answer the
Q23: In the absence of government intervention, a
Q24: Use the table below to answer the
Q26: Use the figure below to answer the
Q27: Use the table below to answer the
Q28: Use the table below to answer the
Q29: Use the table below to answer the
Q30: Use the figure below to answer the
Unlock this Answer For Free Now!
View this answer and more for free by performing one of the following actions

Scan the QR code to install the App and get 2 free unlocks

Unlock quizzes for free by uploading documents