Use the figure below to answer the following question.
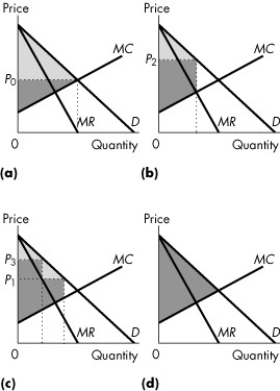
Figure 13.4.4
-Refer to Figure 13.4.4. Consider a market with a perfect price-discriminating monopolist. If the light grey area shows the consumer surplus and the dark grey area shows the producer surplus, which graph correctly represents this firm?
A) (a)
B) (b)
C) (c)
D) (d)
E) none of the graphs
Correct Answer:
Verified
Q86: When a monopoly practices price discrimination
A)it charges
Q94: The more perfectly a monopoly can price
Q94: Use the figure below to answer the
Q95: Use the figure below to answer the
Q96: For a monopoly able to practice perfect
Q99: Rate of return regulation can end up
Q99: A monopolist under rate of return regulation
Q101: Use the information below to answer the
Q105: The capture theory holds that regulations are
Q114: Social interest theory states that
A)public officials favour
Unlock this Answer For Free Now!
View this answer and more for free by performing one of the following actions

Scan the QR code to install the App and get 2 free unlocks

Unlock quizzes for free by uploading documents