Use the figure below to answer the following questions.
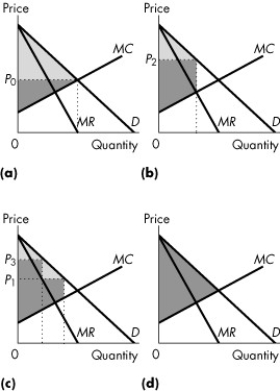
Figure 13.3.2
-Consider Figure 13.3.2. Consider a perfectly competitive market. If the light grey area shows the consumer surplus, and the dark grey area shows the producer surplus, which graph correctly represents this market?
A) (a)
B) (b)
C) (c)
D) (d)
E) (b) and (d)
Correct Answer:
Verified
Q53: Rent seeking
A)is a variable cost and with
Q56: Use the figure below to answer the
Q57: Rent seeking is best defined as
A)an attempt
Q58: Methods of rent seeking include which of
Q60: Taking competitive rent seeking activity into account,the
Q60: Use the figure below to answer the
Q61: Use the figure below to answer the
Q62: Use the information below to answer the
Q63: Which of the following markets will have
Q64: Use the figure below to answer the
Unlock this Answer For Free Now!
View this answer and more for free by performing one of the following actions

Scan the QR code to install the App and get 2 free unlocks

Unlock quizzes for free by uploading documents