Use the figure below to answer the following questions.
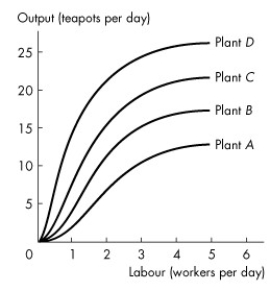
Figure 11.4.1
-Refer to Figure 11.4.1 which shows the total product curves for four different plant sizes as Tania varies the quantity of capital and workers. The curve that represents the plant using the largest amount of capital is
A) plant A.
B) plant B.
C) plant C.
D) plant D.
E) all curves because each plant uses the same number of machines, just different amounts of labour.
Correct Answer:
Verified
Q115: The marginal cost curve slopes upward due
Q116: Use the information below to answer the
Q117: A technological advance will shift (1)TP, AP,
Q119: A production function is the relationship between
Q121: Use the figure below to answer the
Q122: Use the table below to answer the
Q122: If constant returns to scale are present,
A)average
Q123: Which type of cost does not change
Q123: Use the figure below to answer the
Q125: Use the figure below to answer the
Unlock this Answer For Free Now!
View this answer and more for free by performing one of the following actions

Scan the QR code to install the App and get 2 free unlocks

Unlock quizzes for free by uploading documents