Use the figure below to answer the following questions.
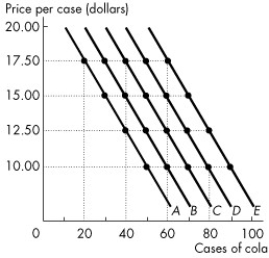
Figure 1A.4.5
-Consider the following information on cola sales by number of cases for a typical university residence floor: Temp. Price (dollars per case) 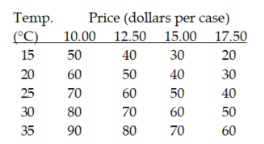
Refer to Figure 1A.4.5. Which one of the following represents what happens when the temperature rises from 20°C to 25°C?
A) The curve shifts from A to B.
B) The curve shifts from C to B.
C) The curve shifts from B to C.
D) The curve shifts along line B.
E) The curve shifts along line C.
Correct Answer:
Verified
Q145: Use the figure below to answer the
Q163: At all points along a straight line,slope
Q166: Use the table below to answer the
Q171: Use the table below to answer the
Q177: Use the figure below to answer the
Q179: Consider the data in Table 1A.4.1.Suppose z
Q183: Use the figure below to answer the
Q185: To graph a relationship among more than
Q186: Use the table below to answer the
Q199: Given the data in Table 1A.4.2,holding price
Unlock this Answer For Free Now!
View this answer and more for free by performing one of the following actions

Scan the QR code to install the App and get 2 free unlocks

Unlock quizzes for free by uploading documents