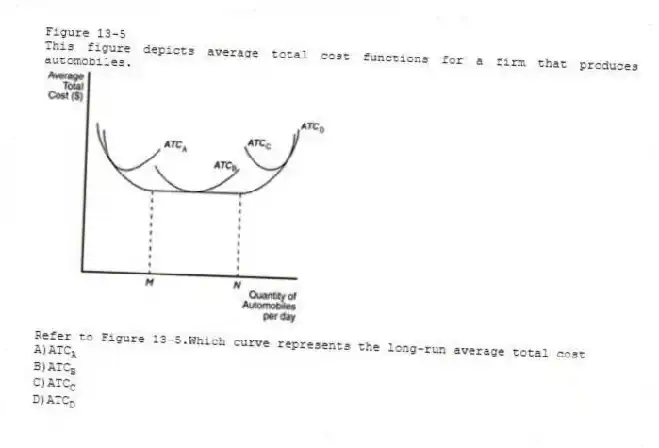
Figure 13-5
This figure depicts average total cost functions for a firm that produces automobiles.
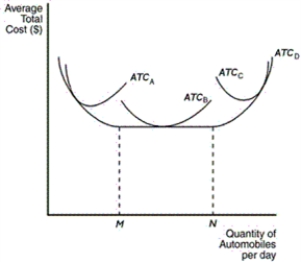
-Refer to Figure 13-5.Which curve represents the long-run average total cost
A) ATCA
B) ATCB
C) ATCC
D) ATCD
Correct Answer:
Verified
Q144: When does specialization among workers occur
A)when each
Q145: Figure 13-6 Q146: When do economies of scale arise Q147: Why are long-run average-total-cost curves often U-shaped Q148: Which of the following can be explained Q150: In reference to setting the production level,what Q151: Figure 13-5 Q152: When do constant returns to scale occur Q153: What property does the long-run average-total-cost curve Q154: Table 13-6
![]()
A)when an
A)for
This figure depicts average total cost
A)when
Tom owns a factory in which
Unlock this Answer For Free Now!
View this answer and more for free by performing one of the following actions

Scan the QR code to install the App and get 2 free unlocks

Unlock quizzes for free by uploading documents