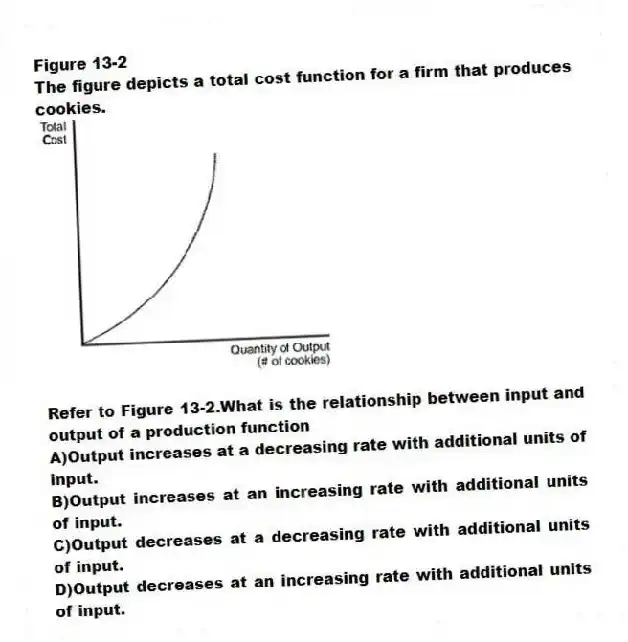
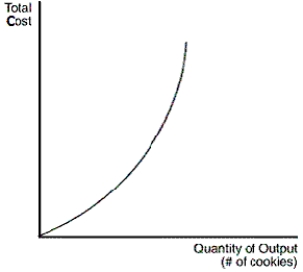
Figure 13-2
The figure depicts a total cost function for a firm that produces cookies.
-Refer to Figure 13-2.What is the relationship between input and output of a production function
A) Output increases at a decreasing rate with additional units of input.
B) Output increases at an increasing rate with additional units of input.
C) Output decreases at a decreasing rate with additional units of input.
D) Output decreases at an increasing rate with additional units of input.
Correct Answer:
Verified
Q41: For a firm,what does the production function
Q42: Which assumption is often realistic for a
Q43: What is the marginal product of an
Q44: What is the cost of producing the
Q45: For a firm,what is the relationship between
Q47: Figure 13-2
The figure depicts a total cost
Q48: Suppose a certain firm is able to
Q49: For a certain firm,the number of workers
Q50: What does a total-cost curve show
A)the relationship
Q177: If a firm produces nothing, which of
Unlock this Answer For Free Now!
View this answer and more for free by performing one of the following actions

Scan the QR code to install the App and get 2 free unlocks

Unlock quizzes for free by uploading documents