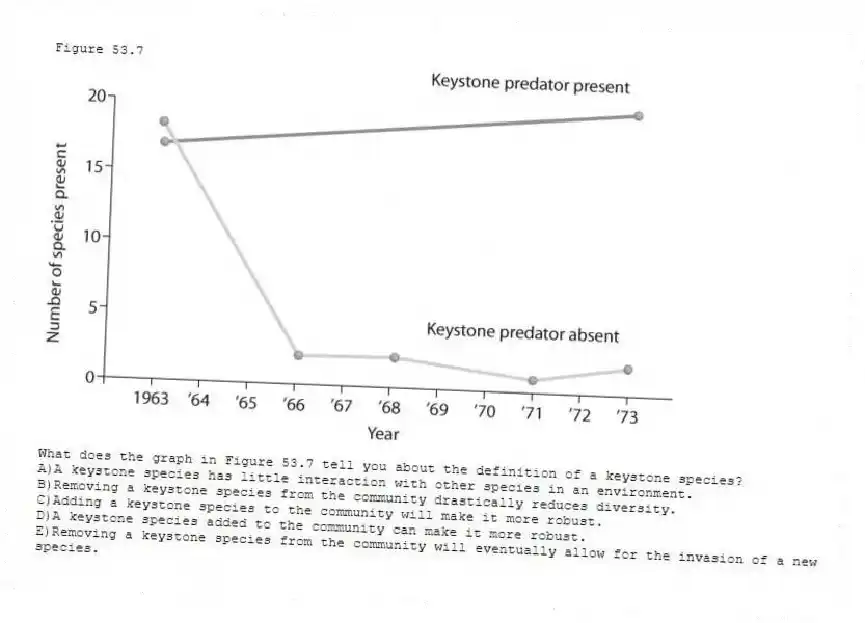
Figure 53.7 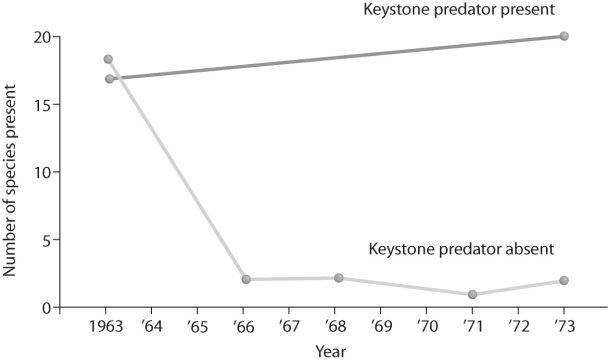
-What does the graph in Figure 53.7 tell you about the definition of a keystone species?
A) A keystone species has little interaction with other species in an environment.
B) Removing a keystone species from the community drastically reduces diversity.
C) Adding a keystone species to the community will make it more robust.
D) A keystone species added to the community can make it more robust.
E) Removing a keystone species from the community will eventually allow for the invasion of a new species.
Correct Answer:
Verified
Q21: What is the main difference between a
Q28: What is the main advantage of controlled
Q29: Figure 53.6 Q31: Figure 53.8 Q32: Figure 53.9 Q35: Figure 53.7 Q36: Bouchard and Brooks studied the effect of Q37: People with at least one copy of Q37: Figure 53.11 Q38: Figure 53.9 Unlock this Answer For Free Now! View this answer and more for free by performing one of the following actions Scan the QR code to install the App and get 2 free unlocks Unlock quizzes for free by uploading documents![]()
![]()
![]()
![]()
![]()
![]()

