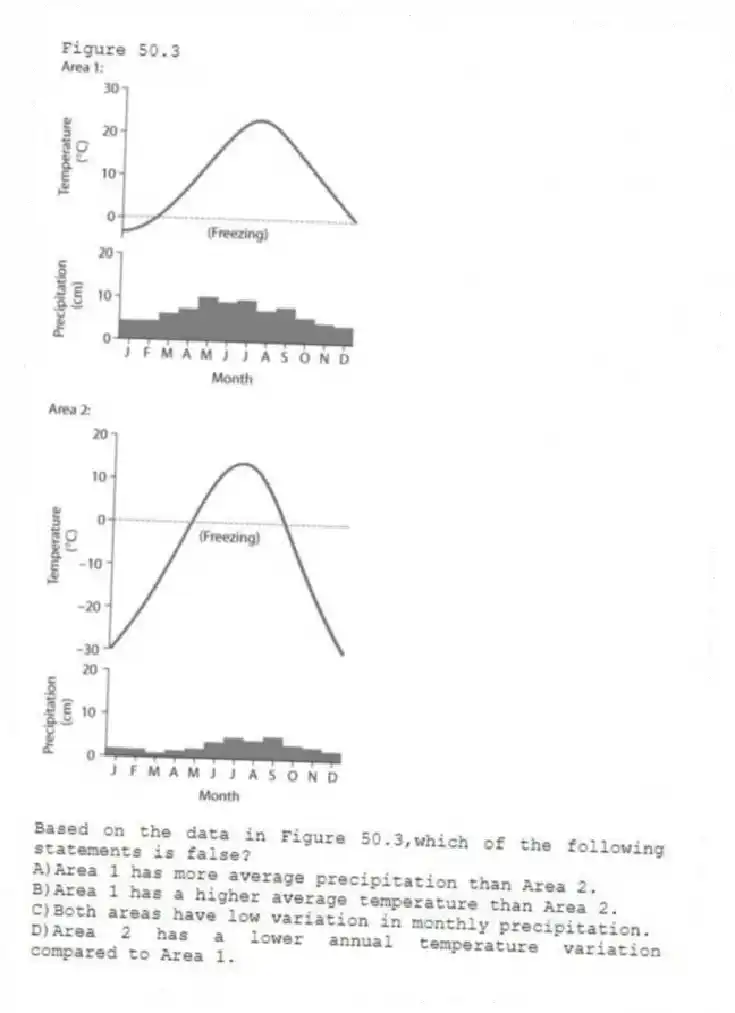
Figure 50.3
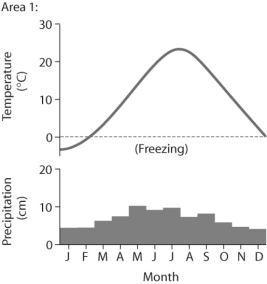
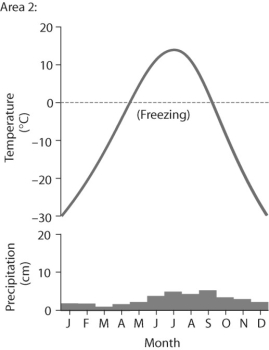
-Based on the data in Figure 50.3,which of the following statements is false?
A) Area 1 has more average precipitation than Area 2.
B) Area 1 has a higher average temperature than Area 2.
C) Both areas have low variation in monthly precipitation.
D) Area 2 has a lower annual temperature variation compared to Area 1.
Correct Answer:
Verified
Q5: In deep water,which of the following abiotic
Q6: Figure 50.2 Q7: Which of the following terms does not Q8: A fish swimming into a bog environment Q9: Figure 50.1 Q11: A fish swimming into an estuary from Q12: The specific abiotic factors defining a biome Q13: Which of the following statements regarding temperate Q14: A fish species known for its success Q15: Figure 50.1 Unlock this Answer For Free Now! View this answer and more for free by performing one of the following actions Scan the QR code to install the App and get 2 free unlocks Unlock quizzes for free by uploading documents
![]()
![]()
![]()

