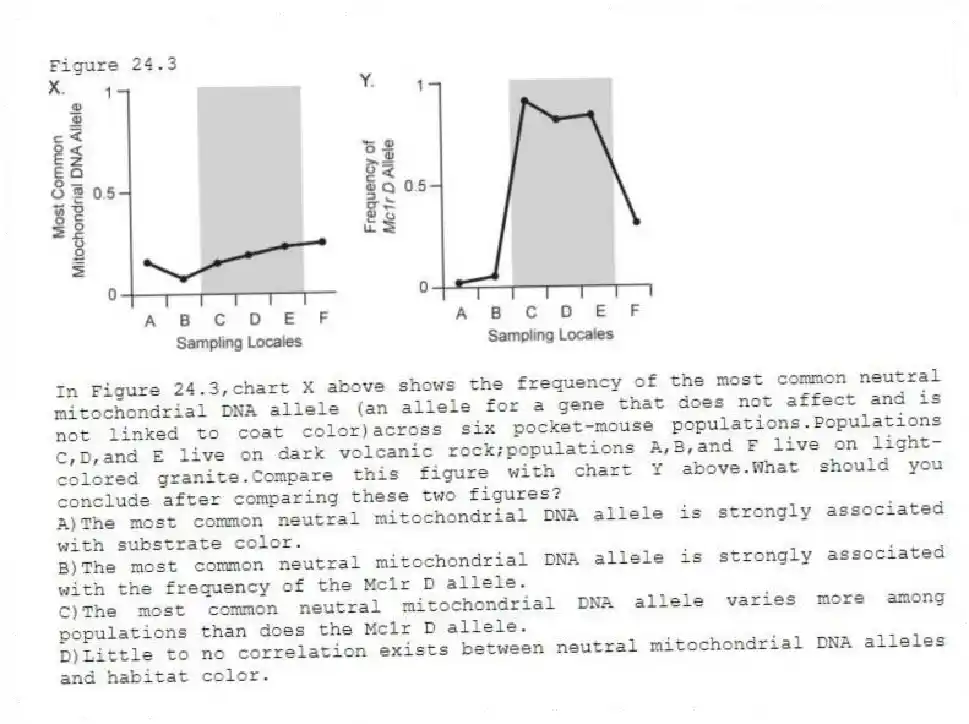
Figure 24.3
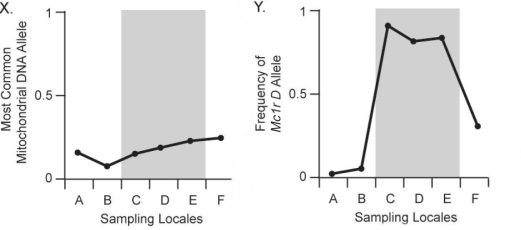
-In Figure 24.3,chart X above shows the frequency of the most common neutral mitochondrial DNA allele (an allele for a gene that does not affect and is not linked to coat color) across six pocket-mouse populations.Populations C,D,and E live on dark volcanic rock;populations A,B,and F live on light-colored granite.Compare this figure with chart Y above.What should you conclude after comparing these two figures?
A) The most common neutral mitochondrial DNA allele is strongly associated with substrate color.
B) The most common neutral mitochondrial DNA allele is strongly associated with the frequency of the Mc1r D allele.
C) The most common neutral mitochondrial DNA allele varies more among populations than does the Mc1r D allele.
D) Little to no correlation exists between neutral mitochondrial DNA alleles and habitat color.
Correct Answer:
Verified
Q18: There is a population of beetles that
Q19: Which of the following statements is an
Q20: If two organisms show a developmental homology,you
Q21: Tourist companies start visiting Island X,where a
Q22: Use the following information when answering the
Q24: Figure 24.1
The following question(s)are based on information
Q25: Figure 24.1
The following question(s)are based on information
Unlock this Answer For Free Now!
View this answer and more for free by performing one of the following actions

Scan the QR code to install the App and get 2 free unlocks

Unlock quizzes for free by uploading documents