Figure 18-2

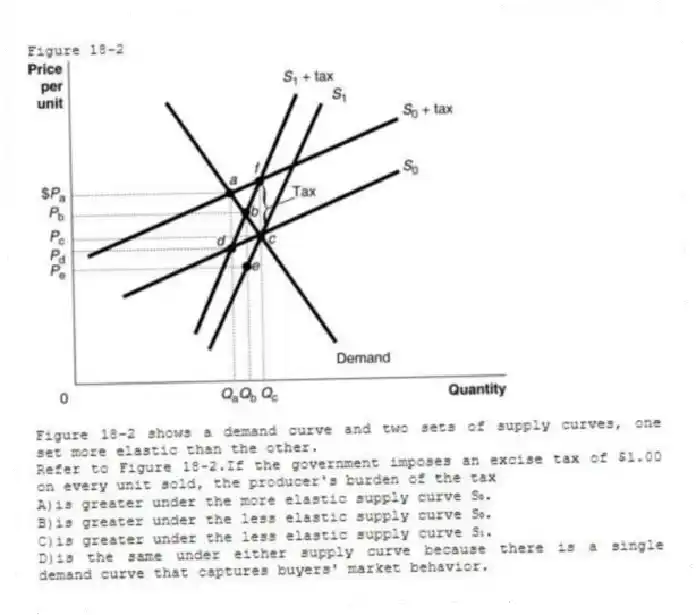
Figure 18-2 shows a demand curve and two sets of supply curves, one set more elastic than the other.
-Refer to Figure 18-2.If the government imposes an excise tax of $1.00 on every unit sold, the producer's burden of the tax
A) is greater under the more elastic supply curve S₀.
B) is greater under the less elastic supply curve S₀.
C) is greater under the less elastic supply curve S₁.
D) is the same under either supply curve because there is a single demand curve that captures buyers' market behavior.
Correct Answer:
Verified
Q160: Suppose the government imposes an 8 percent
Q161: Figure 18-2 Q162: Figure 18-2 Q163: Figure 18-2 Q164: Consider the following methods of taxing a Q166: The corporate income tax is ultimately paid Q167: Figure 18-1 Q168: A CBO study estimated that the excess Q169: Figure 18-2 Q170: Figure 18-1 Unlock this Answer For Free Now! View this answer and more for free by performing one of the following actions Scan the QR code to install the App and get 2 free unlocks Unlock quizzes for free by uploading documents
![]()
![]()
![]()
![]()
![]()
![]()

