Multiple Choice
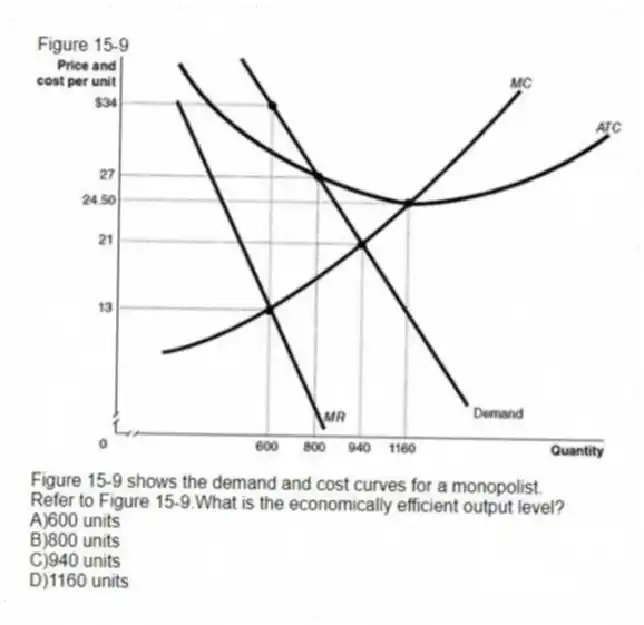
Figure 15-9

Figure 15-9 shows the demand and cost curves for a monopolist.
-Refer to Figure 15-9.What is the economically efficient output level?
A) 600 units
B) 800 units
C) 940 units
D) 1160 units
Correct Answer:
Verified
Related Questions
Q149: Why does a monopoly cause a deadweight
Q150: Economic efficiency in a free market occurs
Q151: Figure 15-9 Q152: Explain why the monopolist has no supply
![]()
Unlock this Answer For Free Now!
View this answer and more for free by performing one of the following actions

Scan the QR code to install the App and get 2 free unlocks

Unlock quizzes for free by uploading documents