Figure 15-3

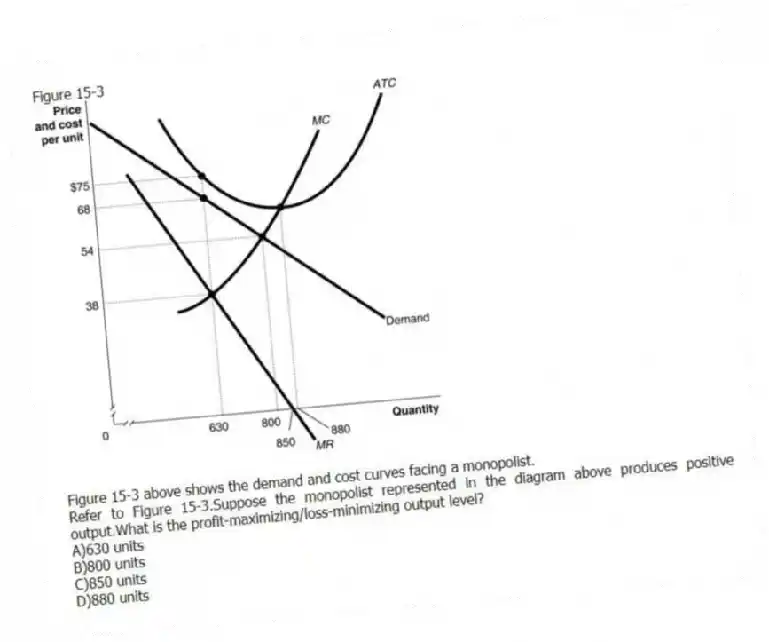
Figure 15-3 above shows the demand and cost curves facing a monopolist.
-Refer to Figure 15-3.Suppose the monopolist represented in the diagram above produces positive output.What is the profit-maximizing/loss-minimizing output level?
A) 630 units
B) 800 units
C) 850 units
D) 880 units
Correct Answer:
Verified
Q87: Figure 15-2 Q114: Figure 15-4 Q115: Figure 15-4 Q116: Table 15-1 Q117: Figure 15-3 Q118: Figure 15-3 Q121: If a monopolist's marginal revenue is $15 Q122: Wendell can sell five motor homes per Q123: In the short run, even if a Q124: Table 15-3 Unlock this Answer For Free Now! View this answer and more for free by performing one of the following actions Scan the QR code to install the App and get 2 free unlocks Unlock quizzes for free by uploading documents
![]()
![]()
![]()
![]()
![]()
![]()
![]()

