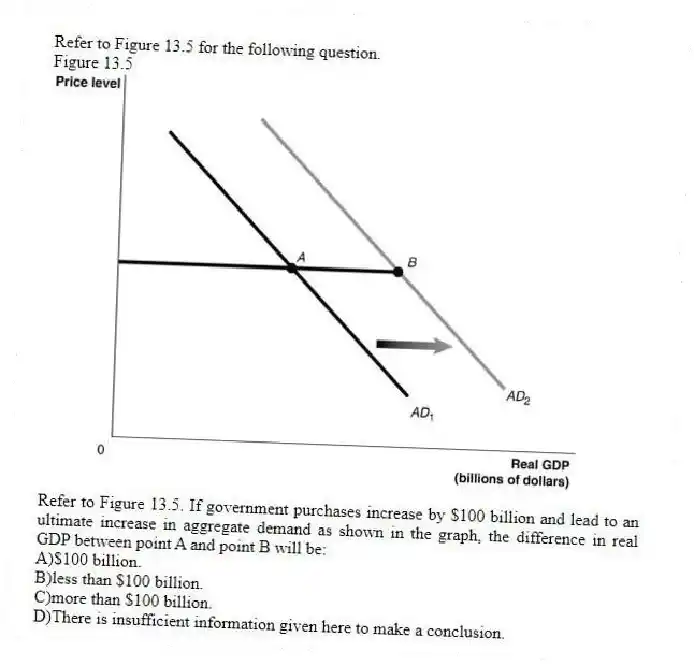
Refer to Figure 13.5 for the following question.
Figure 13.5
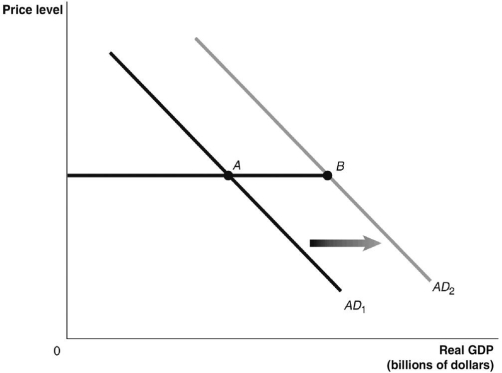
-Refer to Figure 13.5. If government purchases increase by $100 billion and lead to an ultimate increase in aggregate demand as shown in the graph, the difference in real GDP between point A and point B will be:
A) $100 billion.
B) less than $100 billion.
C) more than $100 billion.
D) There is insufficient information given here to make a conclusion.
Correct Answer:
Verified
Q47: Use the dynamic aggregate demand and aggregate
Q48: An appropriate fiscal policy response when aggregate
Q49: Refer to Figure 13.4 for the following
Q51: If the economy is growing beyond potential
Q53: Refer to Figure 13.4 for the following
Q54: What is 'contractionary fiscal policy' and under
Q55: Suppose the economy is in the state
Q56: Identify each of the following as (i)part
Q57: Tax increases on business income slow down
Q142: The multiplier effect is the series of
Unlock this Answer For Free Now!
View this answer and more for free by performing one of the following actions

Scan the QR code to install the App and get 2 free unlocks

Unlock quizzes for free by uploading documents