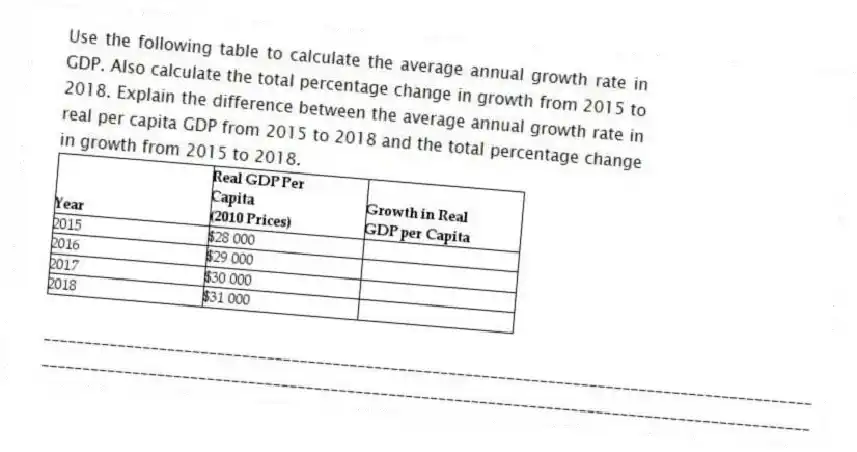
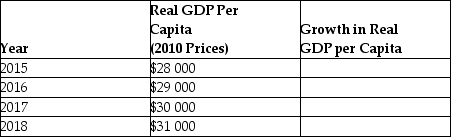
Use the following table to calculate the average annual growth rate in GDP. Also calculate the total percentage change in growth from 2015 to 2018. Explain the difference between the average annual growth rate in real per capita GDP from 2015 to 2018 and the total percentage change in growth from 2015 to 2018.
_____________________________________________________________________________________________
_____________________________________________________________________________________________
Correct Answer:
Verified
View Answer
Unlock this answer now
Get Access to more Verified Answers free of charge
Q13: GDP in a country grew from $10
Q14: If a country's real GDP is rising
Q15: Describe the pattern of growth in GDP
Q16: Mechanical power from around 1750 onward led
Q17: In comparing China and Japan in terms
Q19: During which of the following periods was
Q20: Refer to Table 6.1 for the following
Q21: Labour productivity can be explained by:
A)technological change
Q22: Refer to Figure 6.1 for the following
Q23: An increase in _ shifts _ the
Unlock this Answer For Free Now!
View this answer and more for free by performing one of the following actions

Scan the QR code to install the App and get 2 free unlocks

Unlock quizzes for free by uploading documents