Figure 3.8
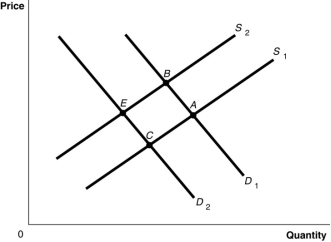
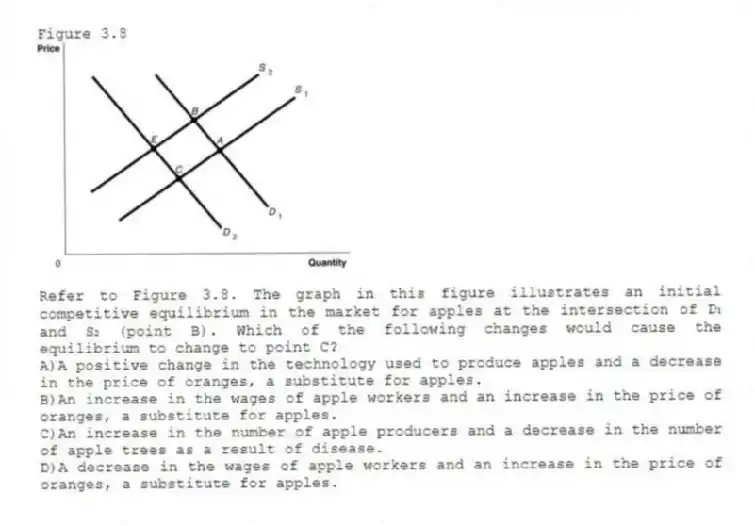
-Refer to Figure 3.8. The graph in this figure illustrates an initial competitive equilibrium in the market for apples at the intersection of D₁ and S₂ (point B) . Which of the following changes would cause the equilibrium to change to point C?
A) A positive change in the technology used to produce apples and a decrease in the price of oranges, a substitute for apples.
B) An increase in the wages of apple workers and an increase in the price of oranges, a substitute for apples.
C) An increase in the number of apple producers and a decrease in the number of apple trees as a result of disease.
D) A decrease in the wages of apple workers and an increase in the price of oranges, a substitute for apples.
Correct Answer:
Verified
Q172: Figure 3.8 Q173: Figure 3.8 Q174: Figure 3.8 Q175: A decrease in the equilibrium quantity for Q176: If a positive change in technology caused Unlock this Answer For Free Now! View this answer and more for free by performing one of the following actions Scan the QR code to install the App and get 2 free unlocks Unlock quizzes for free by uploading documents
![]()
![]()
![]()

