Figure 7-2
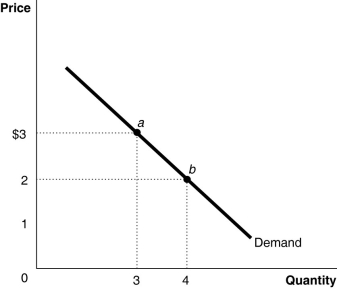 Figure 7-2 represents the demand for ice cream cones.
-Refer to Figure 7-2.Which of the following statements is true?
A) Points a and b are the utility-maximizing quantities of ice cream cones at two different prices of ice cream.
B) Points a and b may not necessarily be the utility-maximizing quantities of ice cream cones at two different prices because we have no information on the consumer's budget or the price of other goods.
C) Point a could be a utility-maximizing choice if the price is $3 but point b may not be because we have no information on the marginal utility per dollar when price changes.
D) Points a and b are derived independently of the utility-maximizing model.
Correct Answer:
Verified
Q82: A consumer maximizes her total utility from
Q85: Arnie Ziffel has $20 per week
Q87: Figure 7-1 Q98: Suppose Barry is maximizing his utility from Q108: The increase in consumption of a good Q109: In order to derive an individual's demand Q111: What is marginal utility and what is Q115: The Wong family consumes 3 pounds of Q132: We can derive the market demand curve Q136: The income effect due to a price
![]()
Unlock this Answer For Free Now!
View this answer and more for free by performing one of the following actions

Scan the QR code to install the App and get 2 free unlocks

Unlock quizzes for free by uploading documents