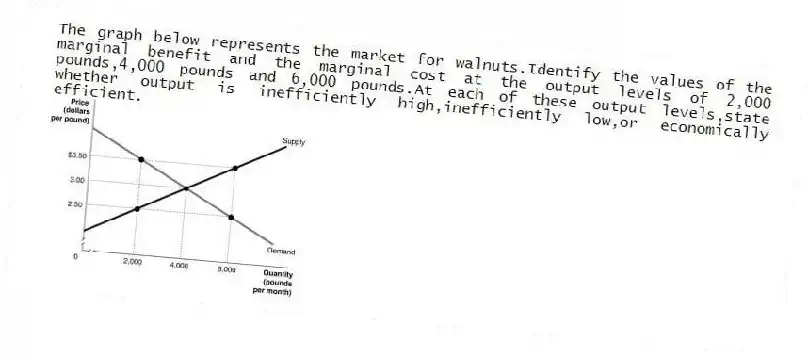
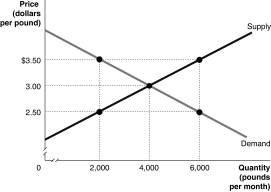
The graph below represents the market for walnuts.Identify the values of the marginal benefit and the marginal cost at the output levels of 2,000 pounds,4,000 pounds and 6,000 pounds.At each of these output levels,state whether output is inefficiently high,inefficiently low,or economically efficient.
Correct Answer:
Verified
View Answer
Unlock this answer now
Get Access to more Verified Answers free of charge
Q110: What is meant by the term "economic
Q201: Table 4-7 Q204: Table 4-7 Q208: The graph below represents the market for Q208: Table 4-7 Q211: Table 4-7 Q213: Table 4-7 Q215: The graph below represents the market for Q218: Table 4-7 Q220: Table 4-7 Unlock this Answer For Free Now! View this answer and more for free by performing one of the following actions Scan the QR code to install the App and get 2 free unlocks Unlock quizzes for free by uploading documents
![]()
![]()
![]()
![]()
![]()
![]()
![]()

