Use the following
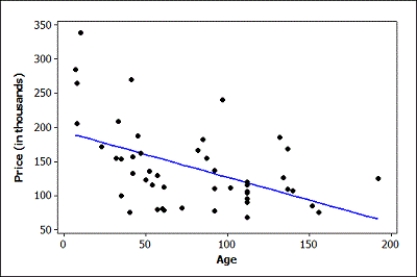
A quantitatively savvy, young couple is interested in purchasing a home in northern New York. They collected data on houses that had recently sold in the area. They want to predict the selling price of homes (in thousands of dollars) based on the age of the home (in years). Some summary statistics, partial regression output, and a scatterplot of the relationship (with regression line) are provided.
Use two decimal places when reporting the results from any calculations, unless otherwise specified.
 The regression equation is Price (in thousands) = 193 - 0.665 Age
Analysis of Variance

-Compute the t test statistic for the slope.
Correct Answer:
Verified
Q113: Use the following
A quantitatively savvy, young
Q114: Use the following
A quantitatively savvy, young
Q115: Use the following
A quantitatively savvy, young
Q116: Use the following
A quantitatively savvy, young
Q117: Use the following
A quantitatively savvy, young
Q118: Use the following
A quantitatively savvy, young
Q120: Use the following
A quantitatively savvy, young
Q121: In a random sample of 41 students,
Q122: In a random sample of 41 students,
Q123: In a random sample of 41 college
Unlock this Answer For Free Now!
View this answer and more for free by performing one of the following actions

Scan the QR code to install the App and get 2 free unlocks

Unlock quizzes for free by uploading documents