Use the following
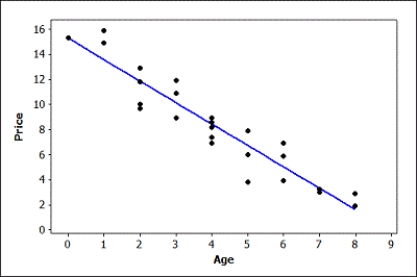
Data were collected on the age (in years) and price (in thousands of dollars) of a random sample of 25 used Hyundai Elantras. A scatterplot of the data (with regression line) and computer output from a regression analysis are provided.
Use three decimal places when reporting the results from any calculations, unless otherwise specified.
The regression equation is Price = 15.3 - 1.71 Age

S = 1.37179 R-Sq = 88.9% R-Sq(adj) = 88.4%
Predicted Values for New Observations

-Construct and interpret a 90% confidence interval for the population slope.
Correct Answer:
Verified
We are 90% sure that for e...
View Answer
Unlock this answer now
Get Access to more Verified Answers free of charge
Q42: Use the following
Data were collected on
Q43: Use the following
Data were collected on
Q44: Use the following
Data were collected on
Q45: Use the following
Data were collected on
Q46: Use the following
Data were collected on
Q48: Use the following
Data were collected on
Q49: Use the following
Data were collected on
Q50: Use the following
Data were collected on
Q51: Use the following
Data were collected on
Q52: Use the following
Data were collected on the
Unlock this Answer For Free Now!
View this answer and more for free by performing one of the following actions

Scan the QR code to install the App and get 2 free unlocks

Unlock quizzes for free by uploading documents