Suppose the frequency curve below is based on 400 cases and is drawn to a much larger scale on a blackboard. Suppose the total area under the blackboard version is 200 square inches. (a) If the area between scores of 30 and 40 equals 50 square inches, how many cases fall between 30 and 40? (b) Suppose 160 cases fall above a score of 50. What is the area under the curve above a score of 50? 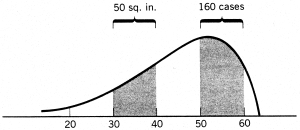
Correct Answer:
Verified
View Answer
Unlock this answer now
Get Access to more Verified Answers free of charge
Q4: In a university, male psychology majors are
Q5: Construct a histogram and frequency polygon for
Q6: (a) Plot the frequency polygon for the
Q7: A human factors psychologist is engaged in
Q8: Construct a cumulative percentage frequency distribution of
Q10: In general, a graph
A) tells less than
Q11: The Y-axis is also called the
A) abscissa
B)
Q12: It is customary to draw the graph
Q13: The best graph for categorical (qualitative) data
Q14: For a histogram, the area encompassed by
Unlock this Answer For Free Now!
View this answer and more for free by performing one of the following actions

Scan the QR code to install the App and get 2 free unlocks

Unlock quizzes for free by uploading documents