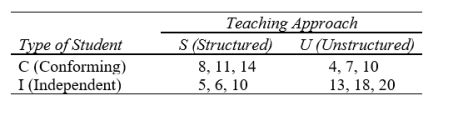
Two approaches, S (structured) and U (unstructured), to teaching a required undergraduate course in social research methods are to be compared with regard to their effects on student interest in social research. Students signing up for the course are classified as Type C (conforming) or Type I (independent) individuals according to personality test results. On a random basis, half of each type of student are assigned to section S of the course and half to section U. At the end of the course, scores are obtained on a scale of interest in social research and are analyzed using a two-factor analysis of variance.
The interest (in social research) scores are given below (normally far more cases would be used).
(a)Compute the variance estimates; complete the F tests at  and
and  ; and draw statistical conclusions. Show your results in a summary analysis of variance table
(b)Construct a table showing cell and marginal means. Considering the F-test results, which means would be of interest? Why?
(c)Construct a graph of the cell means. Draw final conclusions concerning the two treatment variables.
Correct Answer:
Verified
View Answer
Unlock this answer now
Get Access to more Verified Answers free of charge
Q1: In the tables below, population (not sample)
Q2: (a) -(e)Draw a graph of the cell
Q3: Thirty words are flashed on a screen,
Q5: A human factors psychologist investigates which of
Q6: Which is not an advantage of two-factor
Q7: In terms of the two-way table layout
Q8: A main effect is most precisely described
Q9: We are studying the effect of two
Q10: In terms of the two-way table layout
Q11: Suppose, in a two-way analysis of variance,
Unlock this Answer For Free Now!
View this answer and more for free by performing one of the following actions

Scan the QR code to install the App and get 2 free unlocks

Unlock quizzes for free by uploading documents