A student recorded the number of calories in samples of vegetarian and nonvegetarian entrees served by a college dining hall. The student wanted to conduct a hypothesis test of whether the sample data provide evidence that the population mean calorie amounts differ between these two groups.
Summary statistics of the data are provided in the following table: 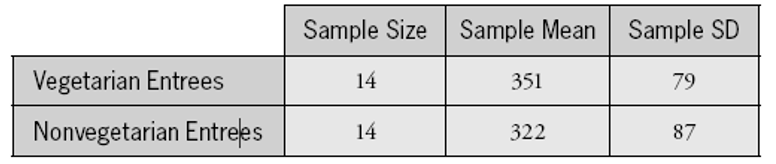 The two-sample -test statistic turns out to equal 0.92 .
a. State the appropriate null and alternative hypotheses in symbols.
b. Do you have enough information to check the technical conditions for a two-sample -test? Explain.
c. Determine the -value as accurately as possible. (Explain what table you use and how you use it.)
d. Summarize your conclusion in a sentence or two, as if you were the statistical consultant reporting back to the student who conducted the study.
e. Describe how the -value would change (smaller, larger, or no change) if all else were the same except the following. (No explanations are needed.)
The sample standard deviations were larger.
The sample sizes were larger.
The sample means were further apart.
Correct Answer:
Verified
View Answer
Unlock this answer now
Get Access to more Verified Answers free of charge
Q19: The following table displays counts obtained
Q20: The following table displays counts obtained from
Q21: For each of the following situations, indicate
Q22: A study of drinking habits of college
Q23: Suppose a large-scale randomized experiment were
Q25: A recent headline announced that mountain
Q26: a. What's wrong with expressing a
Q27: We have been told that
Q28: Researchers studied whether hormone levels tend
Q29: "Low-carb" diets have become quite popular
Unlock this Answer For Free Now!
View this answer and more for free by performing one of the following actions

Scan the QR code to install the App and get 2 free unlocks

Unlock quizzes for free by uploading documents